ZIP
Description
Zero Interaction Potency (ZIP) is a parametric synergy model.
This model uses the multiplicative survival principle (i.e., Bliss), and quantifies synergy similarly to how is done in synergy.combinations.bliss.Bliss. It differs by fitting Hill equations across the entire dose-response surface, holding either d_1 or d_2 constant.
From these fits, ZIP quantifies changes in the EC50 (C) and Hill-slope (h) of each drug, as the other changes. For instance, at a given \(d_1==D_1\), \(d_2==D_2\), ZIP fits two Hill equations:
E_hill(D1, *) = Hill(E0=E(D1, 0))E_hill(*, D2) = Hill(E0=E(0, D2))
These Hill equations are averaged to get a fit value of E at these doses
This is then subtracted from the expected result based on the multiplicative survival principle (Bliss) equations have equivalent h and C to their single-drug counterparts. This difference (delta in their paper) becomes the metric of synergy.
The values of ZIP synergy are interpreted as
Value |
Interpretation |
|---|---|
\[> 0\]
|
Synergistic |
\[< 0\]
|
Antagonistic |
\[= 0\]
|
Additive |
In addition, ZIP computes dose-dependent Hill-coefficients (h1(d2), h2(d1)) and EC50s (C1(d2), C2(d1)) which are stored internally in the model.
Assumptions
Each individual drug follows a Hill equation dose response
All dose response data is within the range
[0, 1]Each drug \(i\) has \(E_i(0) = 1\)
If the single-drug data do not follow a Hill equation, you may consider using another synergy model based on the multiplicative survival principal, such as Bliss. If the other assumptions are not met, you may consider using synergy models based on alternative definitions of synergy.
Defaults
Single-drug models:
Default:
synergy.single.hill.HillRequired:
synergy.single.hill.Hillor subclass
2D
Load and plot example dataset
2D synergy models work with 1D arrays of drug 1 dose, drug 2 dose, and effect.
[1]:
from synergy import datasets
from synergy.utils.plots import plot_heatmap, plot_surface_plotly, set_plotly_interactive

set_plotly_interactive()  # This should only be run in an interactive notebook setting - for other scripts skip this

d1, d2, E = datasets.load_2d_example()
Fit the ZIP model to data
[2]:
from synergy.combination.zero_interaction_potency import ZIP

model = ZIP()
synergy = model.fit(d1, d2, E)
plot_heatmap(d1, d2, synergy, cmap="PRGn", title="ZIP Synergy", center_on_zero=True)
plot_surface_plotly(d1, d2, synergy, cmap="PRGn", title="ZIP Synergy", center_on_zero=True)

Visualize potency and cooperativity shifts
As indicated in the introduction, ZIP stores information about how the potency (C) and cooperativity (h) vary across the dose response surfaces. Plots like this help reveal how ZIP takes slices of the dose-response data.
[3]:
from matplotlib import pyplot as plt

print(f"Drug 1: {model.drug1_model}")
print(f"Drug 2: {model.drug2_model}")

fig = plt.figure(figsize=(7, 5))
plot_heatmap(d1, d2, model._h_21, title="h1(d2)", ax=fig.add_subplot(2, 2, 1))  # h of drug 1, holding drug 2 fixed
plot_heatmap(d1, d2, model._h_12, title="h2(d1)", ax=fig.add_subplot(2, 2, 2))  # h of drug 2, holding drug 1 fixed
plot_heatmap(d1, d2, model._C_21, title="C1(d2)", ax=fig.add_subplot(2, 2, 3))  # C of drug 1, holding drug 2 fixed
plot_heatmap(d1, d2, model._C_12, title="C2(d1)", ax=fig.add_subplot(2, 2, 4))  # h of drug 2, holding drug 1 fixed
plt.tight_layout()
Drug 1: Hill(E0=0.984, Emax=0.533, h=1.68, C=0.961)
Drug 2: Hill(E0=0.985, Emax=0.235, h=1.01, C=1.09)
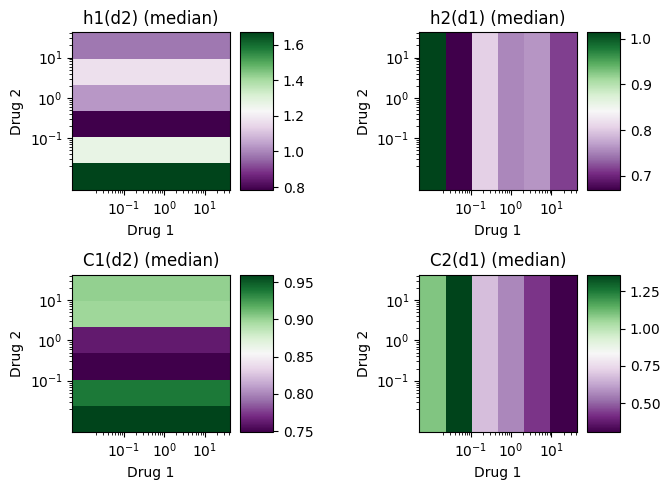
The plots suggest that - adding drug 2 decreases the Hill coefficient of drug 1 (top-left plot, bottom to top) - adding drug 1 decreases the Hill coefficient of drug 2 (top-right plot, left to right) - adding drug 2 tends to decrease the EC50 (i.e., increase potency) of drug 1 (bottom-left plot, bottom to top) - adding drug 1 tends to decrease the EC50 (i.e., increase potency) of drug 2 (bottom-right plot, left to right)
N-drug Combinations
ZIP has been generalized to an \(N\)-drug case in the syergyfinder R package, but not yet in this synergy python package.
References
Yadav, B., Wennerberg, K., Aittokallio, T., & Tang, J. (2015). Searching for Drug Synergy in Complex Dose-Response Landscapes Using an Interaction Potency Model. Computational and structural biotechnology journal, 13, 504–513. https://doi.org/10.1016/j.csbj.2015.09.001
[ ]: