Bliss
Description
The Bliss model requires that the drug effect measured is a probability or fraction between 0 and 1. It works by multiplying the probabilities obtained by each drug alone, and expecting
Bliss synergy is quantified at each tested dose as the difference
The values of Bliss synergy are interpreted as
Value |
Interpretation |
|---|---|
\[> 0\]
|
Synergistic |
\[< 0\]
|
Antagonistic |
\[= 0\]
|
Additive |
Assumptions
All dose response data is within the range
[0, 1]Properly, the data should measure a probability, such as a probablility of a cell remaining alive after treatment
The response should be oriented so that each single drug \(i\) has \(E_i(0) = 1\)
Defaults
Single-drug models:
Default:
synergy.single.log_linear.LogLinearRequired:
synergy.single.DoseResponse1Dor subclass
2D
Load and plot example dataset
2D synergy models work with 1D arrays of drug 1 dose, drug 2 dose, and effect.
[1]:
from synergy import datasets
from synergy.utils.plots import plot_heatmap, plot_surface_plotly, set_plotly_interactive

set_plotly_interactive()  # This should only be run in an interactive notebook setting - for other scripts skip this

d1, d2, E = datasets.load_2d_example()
Plot raw dose response data as a heatmap using synergy.utils.plots.plot_heatmap()
[2]:
# plot_heatmap(d1, d2, E, title="Response Data", cmap="YlGnBu")
Plot raw dose response data as a 3D surface with synergy.utils.plots.plot_surface_plotly()
[3]:
# scatter_points can be used to add a 3d scatter plot over the surface
# plotly's Scatter3D does not appear to work in Jupyter notebooks, but will work if you save the plot to file, e.g., with fname="plot.html"
# scatter_points can be a dict, or a pandas.DataFrame, as long as scatter_points["drug1.conc"], etc return the appropriate arrays.
scatter_points = {
    "drug1.conc": d1,
    "drug2.conc": d2,
    "effect": E
}
plot_surface_plotly(
    d1, d2, E, title="Response Data", cmap="YlGnBu", scatter_points=scatter_points,
    zlabel="Effect"
)  #  fname="plot.html")
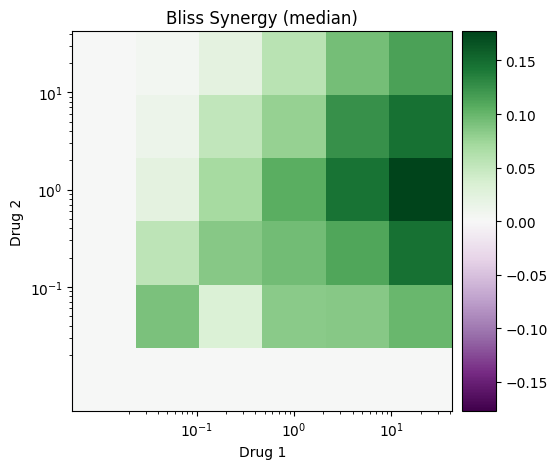
Calculate synergy using the Bliss model
[4]:
from synergy.combination.bliss import Bliss

model = Bliss()
synergy = model.fit(d1, d2, E)
plot_heatmap(d1, d2, synergy, cmap="PRGn", title="Bliss Synergy", center_on_zero=True)
# plot_surface_plotly(d1, d2, synergy, cmap="PRGn", title="Bliss Synergy", center_on_zero=True)
N-drug Combinations
The Bliss model generalizes to \(N\)-drugs by defining \(E_{bliss}\) as
Synergy is defined and interpreted identically as in the 2D case.
[8]:
from synergy.higher.bliss import Bliss
from synergy.utils.plots import plotly_isosurfaces
from synergy import datasets

d, E = datasets.load_3d_example()
model = Bliss()
synergy = model.fit(d, E)

plotly_isosurfaces(d, E, title="3D Response Data", cmap="YlGnBu")  # or add fname= to save to file
plotly_isosurfaces(d, synergy, title="3D Bliss Synergy", cmap="PRGn", center_on_zero=True)
References
Bliss, Chester I. “The toxicity of poisons applied jointly 1.” Annals of applied biology 26.3 (1939): 585-615.
[ ]: